Yep. It's Cold (Weather/Logging Geekery)
I doubt that my level of geekery will surprise any of my readers, but here is data I have been recording of my apartment (bedroom) temperature with matching weather data (from the University's weather station).
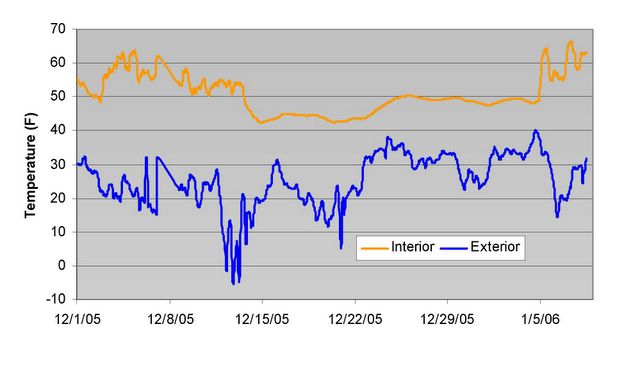
It covers December and the beginning of January; it includes both the end of the term, and the time I was away from home. You can easily tell that stretch--I had the heat completely turned off, so the temperature shows much less variation (i.e., I turn heat on and off if I am in the room). However, even with the heat off, it only drops to the low 40's--no risk of freeze up. But remember: I'm in an apartment on top of another (heated) unit; don't try this at home, kids. You can also tell the neat phase-shift and damping caused by the thermal mass of the building--a spike or drop in outdoor temperature is echoed a bit later inside.
I cranked the heat all the way into the high 60's at times--yeah, I know, pretty wussy. However, I should probably move the temperature measurement location--it is on a shelf above the radiator. I run the kitchen consistently at 50-60 F.
Incidentally, if any of you have random logging projects that you'd like to play with, I strongly recommend the equipment from Onset Computer--relatively low cost, completely intuitive computer interface. It is the equipment I'm using for these measurements. They even have stuff that records motor on/off runtimes, based on either vibration or AC field. In case you're wondering, I'm using one of these to measure T/RH in my apartment.

The second thing I wanted to do was compare the weather between Boston and Waterloo. I have always felt like Waterloo was noticeably colder, but I wanted data to demonstrate how much: as the magnet on my filing cabinet puts it:

So yeah: Waterloo is definitely colder. As you would expect for a location that is away from the tempering effect of the ocean (i.e., large thermal mass that is not frozen). In case you didn't know this, the latitude difference is pretty small (Waterloo is equivalent in latitude to Portland, ME). It seems like there is often a 10 F difference between the two, but there are times when temperatures overlap.
Also, it is interesting to note that some weather patterns come to Boston with about 12-24 hours delay: take a look at the temperature drop on 12/11 and 12/12, or 1/6 and 1/7, for instance.
In terms of adjusting to climate: being around freezing nowadays feels completely balmy to me--just requires a bit of layering up. When it gets down to the 10-15 F range, that's when life sucks. You can see this happens more often up here in the great white North, eh?
posted by Bats @ 11:55 AM
6 comments
![]()

6 Comments:
Wouldn't a real geek also include data gathering methodology? (You may have done that in a previous post with similar data that I am too lazy to search for.)
I'm debating getting a temperature measuring device for internal purposes, as I also eschew most air-conditioning methods, both endo and exo. Though perhaps knowing that it's 108 degrees in my house isn't good for the morale. It hasn't seemed to damage the scotch, at least.
What convenient data source are you using for, say, the Boston and outside Waterloo data?
josakana
Yeah, it's amazing what weather you can become used to. This summer 90 felt nice. 95 was kind of hot. Only above 98 did I really feel disgusting.
And after starting at -42 F, Prudhoe Bay seemed nice and balmy at -5 F.
I'm debating getting a temperature measuring device for internal purposes, as I also eschew most air-conditioning methods
I'd suggest this T/RH unit--it both logs and has an immediate display, although it is a bit pricy. You can get a really basic T/RH for $85.
What convenient data source are you using for, say, the Boston and outside Waterloo data?
Waterloo comes from the archives at the University Weather Station. However, my method for collecting data is completely stupid and data-intensive. WeatherUnderground has data archives, even in CSV format. Then, I manually copy and paste it into a spreadsheet, day by day. Oi. At least it was only a month's worth. It looks like something that completely should be done automatically with clever macros and programming, but I don't write code. At all. Bummer.
And after starting at -42 F, Prudhoe Bay seemed nice and balmy at -5 F.
Whuh. You are way hard core.
"my method for collecting data" -> "my method for collecting Boston data"
Boston was a greenhousy 50F today. Freaky.
Post a Comment
<< Home